Our Approach |
|
With a large number of features, we decided to try two methods -- K Nearest Neighbors and Linear Regression. For KNN, all the features (including property attributes like amenities and number of beds to the number of times certain phrases associated with luxury, budget, or convenience appeared in the host’s descriptions) were used. We varied parameters like number of neighbors, distance norms, and weighting.
We also decided to try linear regression, which could more successfully weight and rule out irrelevant attributes. Even with just linear regression, we were hoping to gain a better understanding of which were the more relevant attributes, to more accurately answer our task. We ran one regression with all features and another using feature selection which dropped attributes with low variance. For both KNN and linear regression, we used the same 3295 training examples, and 500 each for validation and testing. Both were implemented using scikit-learn in Python. |

Figure 1: Miscalculation Error over Number of Neighbors
|

|

|
Results and Future Work
For K Nearest Neighbors, using weighted L1 norms and number of neighbors set to 31 obtained the highest test set accuracy of 0.362. The reasons why we believe the accuracy is low.are the sheer number of attributes (52) we included in the KNN model, which runs into issues with noise, dimensionality, and irrelevant attributes, even with weighting all of them. Future steps could include pre-selecting features that better fit the task.
For Linear Regression, the mean squared error was 36.023 and R-squared was 0.125. In terms of MSE, we found this to be low relative to the mean and standard deviation of our outcome variable. The variables with the largest absolute value coefficients were host response time, a dummy variable for whether or not the host is a "superhost" and a dummy variable for whether or not the listing has internet. Unsurprisingly, the dummy variables for whether or not the room is shared and smoking is allowed had a pretty negative effect on rating, with values of -1.004 and -1.640 respectively. With hopes to improve the accuracy of our results we ran another regression after dropping the features with low variance, using feature selection. This second regression actually did worse with a mean squared error of 39.903 and R-squared value of 0.031. The variables with low variance that were removed were mostly dummy variables equal to 1 if the listing had amenities such as wireless internet, TV, etc. The fact that this model achieved lower accuracy tells us that these features play an important role in determining ratings. In summary, we found that attributes about the host (response time, "superhost" status) and aspects of the room (shared or not, non-smoking) as well as amenities play a key part in predicting listings' ratings. In terms of textual data, we also see that keywords related to budget and convenience actually have a negative effect on ratings, while luxury raises it. This is an interesting insight hosts can leverage in describing their listings. For future work, it would be interesting to see how data from different cities could produce different results in terms of significance of attributes. This would lead to a more generalized guide that could help all Airbnb hosts. Another aspect to explore is the inherent review biases for certain users. Some users systematically rate at a lower or higher level, and these could be accounted for in reviewer fixed effects to get more accurate estimates. |
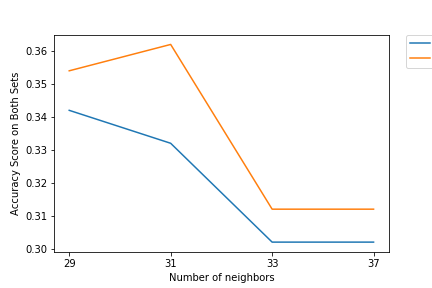
Figure 2: Validation (blue) and Test (red) Set Accuracy
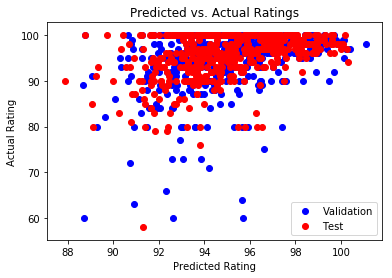
Figure 3: Predicted vs. Actual Ratings without Feature Selection
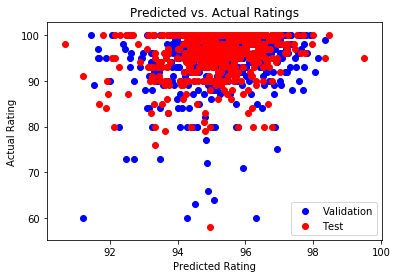
Figure 4: Predicted vs. Actual Ratings with Feature Selection
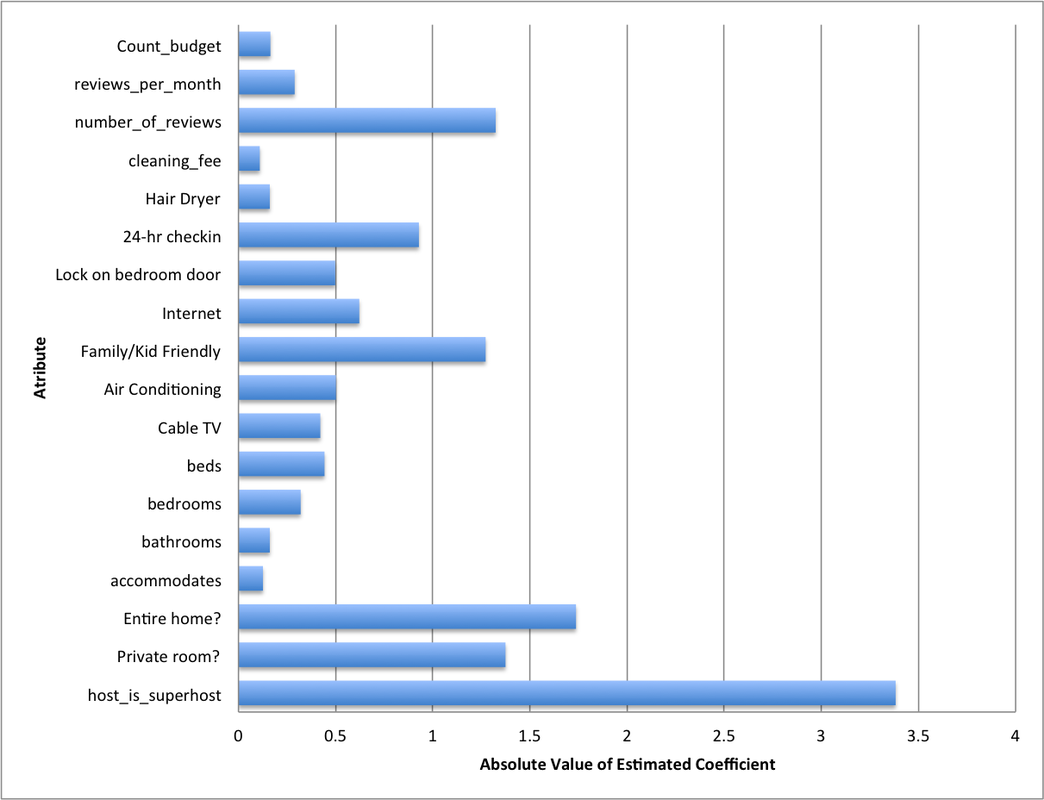
Figure 5: Absolute Value of Coefficients in LR with feature selection
|
